Connecting SQL Server to Power BI: Mastering Data Connectivity
Connecting SQL Server to Power BI supercharges your data visualization and analysis. First, make sure you have access to SQL Server and proper network connectivity. Install the SQL Server Native Client on your Power BI machine and configure your firewall. You’ll benefit from SQL’s robust data handling and Power BI’s visualization prowess. Set up your connection, customize it for security, and automate data refreshes. Create dynamic visualizations and leverage sharing tools for collaboration. Follow these steps, and you’ll master seamless data integration and visualization in no time. Stick around to uncover all the tips and tricks for an efficient setup.
Overview of SQL Server and Power BI
SQL Server and Power BI, both developed by Microsoft, offer powerful tools for managing and visualizing data. SQL Server is a robust relational database management system that excels in data storage, management, and manipulation. It also provides advanced security and data analysis features, making it a cornerstone for any data-driven organization.
Power BI, on the other hand, is a leading business intelligence tool known for its data visualization capabilities. It allows you to create interactive dashboards and reports, making data exploration straightforward and insightful.
The integration of SQL Server with Power BI is seamless, enabling you to pull in data directly from your SQL Server databases into Power BI for further analysis.
With Power BI, you can identify trends and patterns in your data, helping you make informed decisions. Its intuitive interface supports drag-and-drop functionalities, making data visualization a breeze. The tool also supports complex data integration, allowing you to combine data from various sources and uncover deeper insights. For those looking to master these features, Power BI training in Dubai offers an excellent opportunity to enhance your skills and leverage the full potential of this powerful tool.
Pre-requisites to Connect Power BI to SQL
To connect Power BI to SQL Server, you first need to verify that a few key prerequisites are in place. First, confirm that your SQL Server database is either on-premises or in the cloud and make certain it’s accessible and reachable. This is essential for a successful connection setup.
Next, check your access permissions. You’ll need the necessary credentials, such as a username and password or Windows authentication, to connect Power BI to SQL Server. These authentication methods must be properly configured to avoid connection issues.
Network requirements are another critical aspect. Ensure you’re connected to the same Local Area Network (LAN) or Virtual Private Network (VPN) as the SQL Server. This network connectivity allows seamless communication between Power BI and SQL Server.
Additionally, install the SQL Server Native Client on the machine running Power BI. Make sure it’s compatible with your SQL Server version to avoid compatibility issues.
Security considerations are paramount. Ensure your firewall settings and network policies allow Power BI to communicate with SQL Server securely.
Lastly, keep some troubleshooting tips handy. Common issues often relate to misconfigured credentials or network connectivity problems. Double-check these settings if you encounter any issues during the connection process.
Benefits of Using SQL in Power BI
When you use SQL in Power BI, you can handle large datasets efficiently, allowing for smoother data analysis. It speeds up your data processing, making your insights more timely.
Plus, you can manipulate data flexibly, tailoring reports to your specific needs.
Handling Large Datasets
Handling large datasets in Power BI becomes considerably more efficient when you leverage the capabilities of SQL. By using SQL, you can optimize your data handling processes, ensuring that Power BI operates smoothly even with massive amounts of data.
Here are a few techniques that can help:
- Data partitioning: Segmenting your data into manageable chunks allows for quicker access and retrieval. This can notably improve query performance, as smaller datasets are easier to process. You can partition your data based on time, geography, or any other relevant criteria.
- Index optimization: Proper indexing is critical for enhancing query performance. By creating appropriate indexes on your SQL tables, you can speed up data retrieval times, ensuring that your Power BI reports and dashboards load faster. Indexing helps in quickly locating the rows without scanning the entire table.
- Parallel processing: SQL Server’s capability to handle parallel processing allows multiple operations to be carried out simultaneously. This means that large datasets can be processed more quickly, making your data import and transformation tasks in Power BI more efficient.
Speeding up Data Analysis and Processing
Harnessing SQL in Power BI can greatly accelerate your data analysis and processing. By implementing data optimization techniques like using indexes, optimized joins, and improved table structures, you can make sure that your queries run more efficiently.
When your data is structured effectively, query efficiency is maximized, allowing you to retrieve and analyze data faster.
SQL’s powerful functions for complex calculations and transformations further streamline data processing. With these functions, you can perform intricate data manipulations directly within your SQL queries, reducing the need for extensive post-processing in Power BI. This leads to significant speed enhancement in your data workflows.
Performance tuning is another critical aspect. Regularly evaluating and optimizing your queries helps to maintain peak performance. By identifying and addressing performance bottlenecks, you can ensure that your data analysis remains swift and responsive.
Moreover, using parameters for flexible filtering can help reduce unnecessary data processing. By narrowing down data at the query level, you avoid overloading Power BI with excessive data, which enhances overall performance.
Manipulating Data Flexibly
Leveraging SQL in Power BI empowers you to manipulate data flexibly, providing you with the capability to customize data analysis through filtering, combining, and joining tables directly within your queries. This SQL integration enhances your ability to perform advanced querying, making it easier to extract meaningful insights.
Using SQL in Power BI offers several benefits:
- Data Manipulation: With SQL, you can transform your data before it even reaches Power BI. Whether you’re filtering out unnecessary information, combining multiple tables, or joining data from different sources, SQL enables you to do it all seamlessly.
- Flexible Analysis: SQL’s robust querying capabilities mean you can dynamically filter and shape your data to meet specific analysis needs. You can create complex queries to answer intricate business questions, providing more tailored insights.
- Advanced Querying: SQL allows you to go beyond the basic functionalities of Power BI. You can write sophisticated queries to aggregate, group, and sort data in ways that standard Power BI tools may not support, giving you more control over your analysis.
Incorporating SQL into your Power BI workflow guarantees that your data analysis is both flexible and powerful, empowering you to make more informed business decisions.
Steps to Connect Power BI to SQL Server
To connect Power BI to SQL Server, start by launching Power BI Desktop and clicking on ‘Get Data‘. This will open a window where you can select ‘SQL Server’ from the list of data sources. Enter your server details and choose the database you want to connect to.
Ensuring data security is paramount, so make sure you use appropriate authentication methods and permissions. Once connected, you can proceed to query optimization to improve performance by fetching only the necessary data. This step is essential for efficient data modeling, helping you shape the dataset according to your analysis needs.
Next, you might want to perform data transformation to clean and prepare your data. Power BI offers powerful tools for this, allowing you to manipulate data flexibly and efficiently. After transforming the data, load it into Power BI.
This is where data visualization comes into play. Use Power BI’s robust visualization features to create insightful charts, graphs, and other visual elements that make your data easy to understand.
Establishing a Connection to SQL Server
First, enter the server’s name or IP address to establish a connection to SQL Server in Power BI. You’ll need to choose an authentication method, either Windows Authentication or Database Authentication.
If you opt for Windows Authentication, Power BI will use your current user credentials. For Database Authentication, you’ll have to provide your SQL Server username and password.
Follow these steps to guarantee a successful connection:
- Connection String Customization: Customize your connection string to specify any necessary parameters, such as database name, timeout settings, and data encryption options. This can aid in connection troubleshooting and ensuring peak performance.
- Security Considerations: Make sure to take into account security aspects, like ensuring your connection is encrypted to protect sensitive data. Both Windows and Database Authentication have their own security implications, so choose accordingly.
- Data Refresh Scheduling: Once your connection is established, set up a data refresh schedule in Power BI to keep your reports up-to-date. This will ensure that your data remains current without manually updating it each time.
Customizing and Refining Data
Power Query Editor in Power BI offers powerful tools for transforming your data, including filtering, sorting, and aggregating information. You can start by performing data cleansing tasks to make sure your dataset is free from errors and inconsistencies. Removing duplicates, addressing missing values, and standardizing formats are vital steps in this process.
To enhance your data further, use advanced transformations such as merging tables and creating calculated columns. These transformations allow you to combine and manipulate data in meaningful ways, making it easier to analyze complex datasets. Data enrichment is another essential step, where you can add new columns or rows based on existing data, providing deeper insights.
Engage in data profiling to understand your data’s structure and quality. Power Query Editor provides various profiling tools that help you identify potential issues, such as outliers or skewed distributions, allowing you to address them before analysis.
Data normalization, or standardizing your data, ensures that different datasets are compatible and can be compared accurately.
Creating Visualizations
Explore the world of visual storytelling by creating dynamic visualizations in Power BI. Data visualization lets you transform raw data from SQL Server into compelling visuals that facilitate data exploration and decision-making.
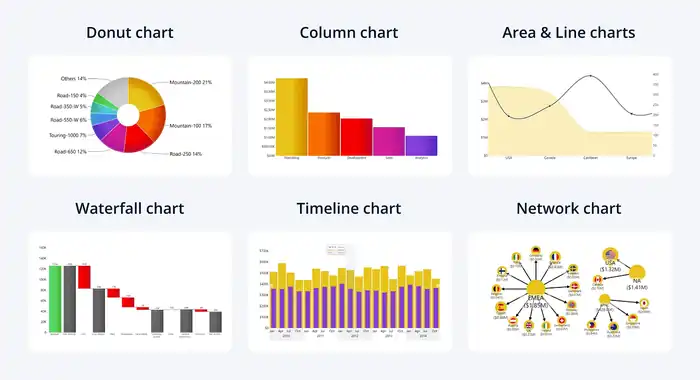
First, immerse yourself in visual design by choosing from a variety of visual options like bar charts, line charts, pie charts, maps, and tables. Customize these visuals with different colors, labels, and fonts to match your brand or highlight key data points. This flexibility makes your dashboard creation not only functional but also visually appealing.
Next, enhance your interactive reporting by adding filters, slicers, and drill-through actions. These features enable users to interact with the data, uncovering deeper insights without needing to switch between multiple reports. Power BI’s interactivity ensures that your audience remains engaged and can explore the data in real-time.
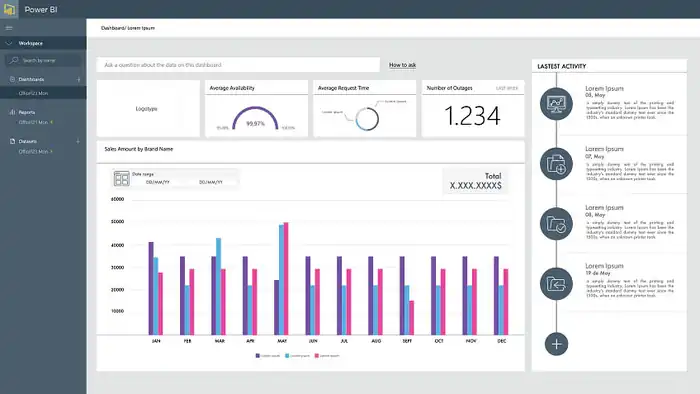
Finally, create a holistic dashboard that encapsulates all your visualizations in a single view. This thorough approach to data exploration allows stakeholders to quickly grasp complex data trends and make informed decisions.
Here’s a quick guide to get you started:
- Choose appropriate visual types for your data.
- Customize visuals to enhance clarity.
- Add interactive elements for deeper insights.
Sharing and Collaboration
When you’ve created the perfect dashboard, sharing and collaborating on your insights in Power BI becomes important for driving informed decisions across your team. Power BI offers robust collaboration features that make this process seamless. Using the sharing options, you can easily distribute your dashboards and reports to your team members or stakeholders. This guarantees everyone has access to the same critical data.
Power BI’s real-time interactions allow team members to work together simultaneously, making data-driven decisions more efficient. You can embed reports in websites or share interactive reports directly, enabling broader access and engagement.
Commenting capabilities within Power BI make it easy for users to add context, raise questions, or highlight important insights directly on the dashboard. This feature fosters open discussions and ensures that everyone’s input is captured and considered.
Moreover, Power BI’s tagging functionality lets you mention specific team members in comments, drawing their attention to important insights or action items. This targeted communication enhances collaboration and ensures that the right people are notified promptly.
Refreshing Data from SQL Server
To keep your collaborative dashboards accurate and timely, you need to set up scheduled data refreshes from SQL Server. This guarantees that your datasets, reports, and dashboards are always up-to-date with the latest information.
Here’s a quick guide to get you started on refreshing data from SQL Server in Power BI.
- Define Frequency and Timing: First, determine how often you need your data refresh. Depending on your needs, you can set it to refresh daily, weekly, or even multiple times a day. Adjust the timing based on your SQL Server’s performance and the importance of the data.
- Adjust Connection Settings: Make sure your connection settings in Power BI are correctly configured. This includes verifying that the gateway is properly set up and ensuring that your credentials are accurate. This step is essential for maintaining seamless data synchronization.
- Optimize Queries: For efficient data refresh, focus on query optimization. This means refining your SQL queries to minimize load times and reduce resource consumption. Optimized queries not only speed up refreshes but also help in achieving real-time updates more effectively.
Best Practices and Performance Optimization
Although maintaining a well-structured and normalized SQL database schema is crucial, optimizing query performance and leveraging Power BI’s data model features can greatly enhance your system’s efficiency.
Start with query optimization by making sure your SQL queries are efficient and avoid unnecessary data retrieval. Use indexing strategies to speed up data access; appropriate indexing can greatly reduce query execution time.
In Power BI, focus on data modeling by creating calculated columns and measures wisely. Query folding can push some operations back to SQL Server, reducing load on Power BI. When deciding between DirectQuery and Import mode, consider DirectQuery for real-time data scenarios, but remember it depends heavily on query performance.
Implement data compression and partitioning in SQL Server to manage large datasets efficiently. Compression reduces storage requirements, while partitioning can help manage and access data faster.
Regular performance monitoring is essential. Use SQL Server Profiler to analyze and troubleshoot query performance. Power BI’s Performance Analyzer helps identify and resolve bottlenecks within your reports.


