Crystal Reports vs. Power BI: Which is The Best?
When comparing Crystal Reports and Power BI, you’ll find each serves different needs. Crystal Reports excels in creating highly formatted, pixel-perfect static reports. It’s great for traditional data analysis and integrates well with legacy systems. On the other hand, Power BI offers dynamic data visualization and real-time analytics with a user-friendly interface. Power BI connects seamlessly with various data sources, making it ideal for modern, interactive dashboards and real-time collaboration. Pricing for Crystal Reports usually involves a one-time purchase, while Power BI typically operates on a subscription model. Each has unique strengths suited to particular reporting needs—explore further to make the best choice.
Overview of Crystal Reports and Power BI
When comparing Crystal Reports and Power BI, you’ll notice they both offer powerful reporting capabilities but cater to different needs. Crystal Reports excels in detailed, static reports, while Power BI focuses on interactive, real-time data visualization.
Understanding these differences can help you choose the right tool for your specific requirements.
Crystal Reports
Crystal Reports, a long-standing business intelligence application, excels in designing and generating detailed reports with advanced formatting and robust data sorting options. You’ll find this tool particularly useful for its powerful data manipulation capabilities, allowing you to transform raw data into meaningful insights.
The application’s report customization features let you tailor reports to meet specific business needs, ensuring that you always get the exact information you require.
One of the key strengths of Crystal Reports is its seamless database connectivity. You can connect to a variety of data sources, including SQL databases, Excel spreadsheets, and even cloud-based solutions, making it easy to pull in the data you need for thorough reporting.
The design flexibility offered by Crystal Reports is another standout feature. You can create intricate report layouts with sub-reports, charts, and cross-tabs, giving you the freedom to present your data exactly how you want it.
Lastly, Crystal Reports provides extensive export options. Whether you need your report in PDF, Excel, or another format, you can easily export and share your findings with stakeholders. This versatility makes Crystal Reports a robust tool for any business looking to harness the power of detailed reporting.
Power BI
While Crystal Reports excels at generating detailed, customized reports, Power BI, a cloud-based business analytics service by Microsoft, offers powerful tools to visualize and analyze data from multiple sources with ease. Power BI is designed to transform raw data into interactive dashboards and detailed reports. You’ll find its user-friendly interface makes it simple to navigate and create visualizations, even if you’re not a data expert.
Power BI stands out in the field of data analytics and business intelligence by offering robust data modeling capabilities. You can effortlessly connect to various data sources, whether they’re on-premises or in the cloud. This versatility is a game-changer when you need to conduct comparison analysis across different datasets.
One of Power BI’s strongest features is its data visualization prowess. You can create compelling charts, graphs, and maps that make your data insights accessible and understandable. The reporting tools are intuitive, allowing you to drill down into specifics without getting lost in complexity. For those looking to harness these capabilities, Power BI training in Dubai is an excellent option to consider.
Crystal Reports vs Power BI: The Differences
Purpose and Features
Crystal Reports
Creating pixel-perfect, static reports with complex layouts, Crystal Reports excels in delivering advanced report formatting and precise data presentation.
With Crystal Reports customization, you can tailor legacy reporting tools to your needs. It’s classic reporting software at its finest, ideal for traditional data analysis.
From report generation to data sorting, grouping, and applying complex formulas, it’s perfect for detailed, printed reports.
Power BI
How does Power BI transform data analysis with its dynamic data visualization and exploration capabilities?
It excels in data modelling, allowing you to connect various data sources seamlessly. Its dashboard design offers interactive filtering and drill-down options. Performance tuning guarantees smooth, real-time analytics.
Advanced visualization techniques provide customizable insights, empowering self-service analytics and independent data exploration at its best.
Data Visualisation
Power BI
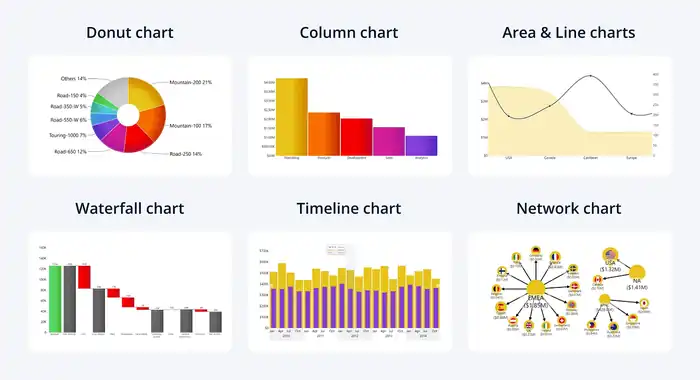
Power BI stands out with its powerful visualisation capabilities. It offers interactive charts, graphs, and customisable maps that make your data presentation both compelling and efficient.
You can leverage advanced analytics, robust data modelling, and real-time insights. Its extensive data connectivity and sophisticated visualisation techniques guarantee you get the most out of your data, enhancing decision-making processes and overall efficiency.
Crystal Reports
Crystal Reports excels in producing traditional static reports with detailed and precise data visualisation through charts, graphs, and customisable tables.
You can leverage its customisation options to enhance reporting precision and data formatting. It’s perfect for creating static reports with various visual elements, ensuring your reports are both informative and visually appealing.
This makes it ideal for specific, detailed reporting needs.
Reporting Capabilities
Crystal Reports
Exploring Crystal Reports, you’ll discover its extensive reporting capabilities set it apart. It features elements like tables, charts, graphs, and images that offer advanced report formatting and data manipulation.
With robust formatting options, report customization, and exporting options, you can tailor your reports precisely. Additionally, Crystal Reports guarantees data security, making it a dependable tool for thorough and secure reporting.
Power BI
Power BI excels at self-service analytics and data exploration, offering dynamic, interactive reports with real-time analytics and detailed data analysis.
Among the Power BI advantages are its flexibility and robust visualizations.
However, Power BI limitations include a steep learning curve for complex tasks.
In a Power BI comparison, its frequent Power BI updates and alignment with current Power BI trends make it a strong contender.
Data Sources
Crystal Reports
Crystal Reports excels in its compatibility with a wide array of data sources, ranging from traditional databases like SQL Server and Oracle to spreadsheets and web services. You’ll appreciate the robust data connections and the customization options available.
However, be mindful of Crystal Reports’ limitations in performance and user interface, which may affect your overall experience depending on your specific needs.
Power BI
With its broad compatibility, Power BI offers seamless integration with a vast range of data sources, including cloud-based services, on-premises databases, and online sources.
You can leverage Power BI integration for advanced analytics, data modeling, and creating interactive dashboards.
This guarantees you gain real-time insights, making data-driven decisions more accessible and efficient across various platforms and environments.
Integration
Crystal Reports
You can easily embed Crystal Reports within third-party applications to seamlessly generate and display reports in your existing systems.
With Crystal Reports customization, you can tailor your reports to fit specific needs.
Although it doesn’t offer interactive dashboards, it excels in advanced analytics, report scheduling, and mobile accessibility.
This makes it a versatile tool for diverse reporting requirements.
Power BI
Unlike Crystal Reports, Power BI offers seamless integration within the extensive Microsoft ecosystem, leveraging tools like Excel, SharePoint, and Teams for enhanced functionality.
You’ll benefit from advanced data modeling, intuitive dashboard design, and robust data analysis capabilities.
Power BI’s rich visualization options and interactive reporting make it a powerful choice for dynamic data presentation and thorough business insights.
User-Friendliness
Power BI
Power BI stands out with its user-friendly interface and intuitive drag-and-drop functionality, making data presentation a breeze with pre-built visualizations.
Power BI capabilities provide seamless data integration and real-time analytics. Among the Power BI advantages are its easy learning curve and robust Power BI integrations.
In a Power BI comparison, its user interface clearly excels in simplicity and efficiency.
Crystal Reports
Using Crystal Reports requires a solid grasp of database concepts and report design, making it less user-friendly for beginners. You’ll benefit from its design flexibility, extensive data aggregation, and powerful report customization.
With advanced formatting options and performance tuning capabilities, Crystal Reports excels in creating precise, highly formatted reports. However, expect a steeper learning curve compared to more intuitive tools.
Pricing and Licensing
Crystal Reports
Crystal Reports offers various pricing and licensing models, including standalone perpetual licenses with potential fees for upgrades and support.
You can leverage its robust data manipulation capabilities, extensive formatting options, and powerful customization features. Additionally, it provides diverse exporting options to suit your needs.
When making performance comparisons, note that Crystal Reports excels in detailed and formatted report generation tailored to specific business requirements.
Power BI
Power BI’s variety of pricing and licensing options guarantees there’s a solution for everyone, from individual users to large enterprises.
With its free Power BI Desktop, you get basic functionality for data analysis and visualization techniques.
For more advanced features like interactive dashboards and all-encompassing reporting solutions, the paid tiers offer enhanced business intelligence tools, making it a versatile choice for diverse needs.
Deployment Options
Crystal Reports
Unlike other tools, Crystal Reports provides the flexibility of local deployment on individual machines, making it ideal for offline access and scenarios with limited connectivity.
You’ll appreciate its robust report generation, extensive formatting options, and strong data connectivity.
Plus, its customization features and exporting capabilities guarantee you can tailor reports to your needs and share them effectively, all without relying on internet access.
Power BI
While Crystal Reports excels in offline environments, you’ll find Power BI’s cloud-based deployment perfect for facilitating remote work and real-time collaboration.
Power BI enhances your business intelligence capabilities with robust data modeling, interactive dashboards, and advanced data analytics. It excels in data visualization, offering a seamless experience for teams to collaborate and make data-driven decisions from anywhere, anytime.


