Top 12 Power BI Project Ideas for 2024
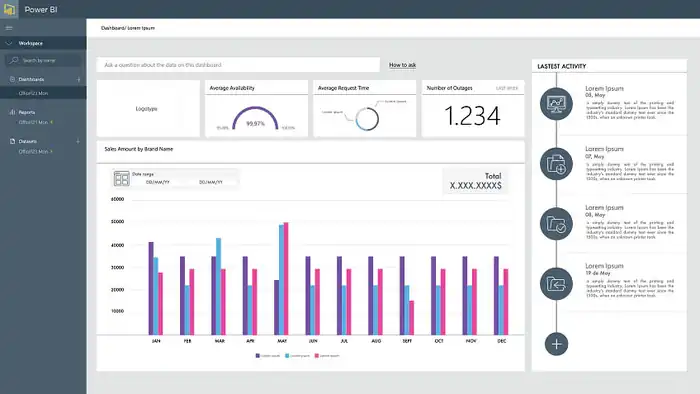
In 2024, you can explore Power BI to the fullest with projects that provide actionable insights. Track employee productivity to identify bottlenecks and optimize resource allocation. Utilize project management visualizations for up-to-date information on timelines and budgets. Improve your website’s user experience by analyzing page views and bounce rates. Enhance inventory management by monitoring stock levels and assessing suppliers. Enhance HR decisions with reports on turnover and training effectiveness. Delve into healthcare spending trends or visualize airport operations to identify inefficiencies. For a creative approach, analyze life expectancy or movie sales data. You’re on the verge of discovering exciting projects!
Power BI Project Ideas
Basic Projects
#1 Financial performance tracking
Tracking financial performance using Power BI offers a straightforward yet powerful way to gain insights into a business’s financial health. You can easily set up a project to monitor various financial metrics and make informed decisions. Power BI can help you with:
- Revenue forecasting
- Expense tracking
- Profit margin analysis
- Financial trend monitoring
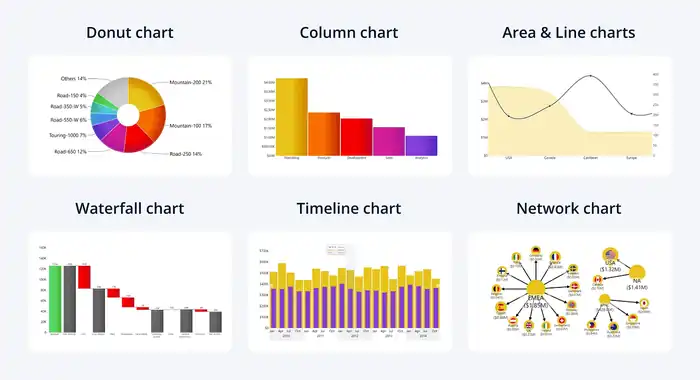
To start, gather key datasets such as sales data, expense reports, and budget forecasts. These datasets form the backbone of your financial performance tracking project. Once you’ve got your data, you can create various visualizations in Power BI to bring it to life. For example, use line charts for financial trend monitoring and bar charts for budget variance analysis.
By tracking these metrics, you gain valuable business insights. For instance, revenue forecasting helps you predict future sales and plan accordingly. Expense tracking ensures you’re aware of where your money is going, while profit margin analysis gives you a clear picture of your profitability. Financial trend monitoring allows you to spot patterns and make proactive adjustments.
Implementing these visualizations will enable you to better manage your finances and make strategic decisions. With Power BI, financial performance tracking becomes not just a task, but a strategic advantage for your business.
#2 Marketing campaign analysis
Shifting focus from financial metrics, marketing campaign analysis with Power BI offers a dynamic way to measure the effectiveness of your marketing efforts. By utilizing Power BI, you can integrate key datasets such as social media tracking, email marketing performance, website traffic, and customer segmentation. This allows you to thoroughly understand your marketing strategies’ impact.
With social media tracking data, you can visualize engagement metrics across different platforms, helping you identify which channels yield the highest interaction.
For email marketing, you can analyze open rates, click-through rates, and conversion rates to gauge campaign effectiveness.
Website traffic data lets you monitor user behavior, pinpointing which pages attract the most visitors and where drop-offs occur.
Customer segmentation helps you tailor your marketing efforts by breaking down your audience into meaningful categories based on demographics, purchasing behavior, or engagement levels.
Power BI’s robust visualization tools, such as bar charts, line graphs, and heat maps, are essential for making this data accessible and actionable. For those looking to unlock the full potential of these tools, Power BI training in Dubai is an excellent opportunity. These visualizations can reveal patterns and trends, providing valuable insights for optimizing future campaigns.
#3 Sales analysis
Sales analysis projects using Power BI provide a simple yet effective way to explore sales performance metrics and trends. You can use various datasets, such as historical sales data, customer demographics, and market conditions, to gain actionable insights. These projects can help you understand not just what’s happening, but also why it’s happening and what can be done to improve sales outcomes.
- Product segmentation: Break down your sales data by product categories to identify best-sellers and underperformers. This can help you focus your marketing efforts and inventory management.
- Geographic analysis: Use maps and location-based data to see where your products are selling the most. This can guide regional marketing strategies and distribution logistics.
- Time trend analysis: Analyze sales trends over different time periods—days, months, or years. This helps in understanding seasonality and planning for peak sales periods.
- Customer behavior: Study purchasing patterns and customer preferences. This can help in tailoring promotions and improving customer satisfaction.
Relevant visualizations include bar charts, line graphs, and geographic heat maps. By utilizing these visual tools, you can enhance your forecasting accuracy and make more informed business decisions.
Intermediate Projects
#4 Anomaly detection in transactions
Anomaly detection in transactions leverages Power BI’s advanced analytics to identify unusual patterns that could indicate fraud or errors. By focusing on fraud detection, transaction monitoring, and anomaly identification, you can pinpoint suspicious activity and data anomalies in financial transactions. This intermediate project is essential for businesses aiming to secure their financial processes.
To get started, you’ll need relevant datasets like transaction logs, customer profiles, and historical transaction data. These datasets provide a robust foundation for identifying outliers and trends that deviate from the norm. Incorporating Power BI’s visualization tools helps bring these insights to life, making it easier to spot red flags.
Here are four key visualizations to explore:
- Heatmaps: Highlight areas with unusually high transaction volumes or amounts, aiding in fraud detection.
- Time Series Charts: Track transactions over time to identify spikes or drops that could indicate suspicious activity.
- Scatter Plots: Visualize relationships between different transaction variables to detect outliers.
- Box Plots: Summarize data distributions and identify anomalies.
Anomaly detection using Power BI can provide significant business insights. It helps improve transaction monitoring efficiency and enhances overall security. By identifying data anomalies early, companies can mitigate risks and protect their financial assets.
#5 Health expenditure analysis
When diving into health expenditure analysis, you’ll leverage Power BI to uncover critical insights into how funds are allocated and spent within the healthcare sector.
You’ll start by examining healthcare spending trends, identifying patterns over time, and understanding shifts in investment. Power BI’s robust data visualization tools make it easy to compare these trends on a global scale, giving you a clear picture of how different countries allocate their healthcare budgets.
Using datasets from sources like the World Health Organization and national healthcare databases, you can analyze the impact of policy changes on healthcare spending. For instance, visualize how new healthcare policies in various regions have influenced expenditures and outcomes.
Another critical aspect is identifying healthcare cost drivers, such as pharmaceuticals, hospital services, and administrative costs. By breaking down these elements, you can pinpoint areas where costs are rising or falling.
Additionally, Power BI allows you to differentiate between public vs. private expenditures, providing insights into how government and private sector investments vary. These analyses can inform policy decisions, optimize resource allocation, and ultimately improve healthcare delivery.
With Power BI, you’ll transform complex data into actionable insights that drive better health outcomes.
#6 Energy production analysis
Explore energy production analysis with Power BI to uncover valuable insights on how different energy sources contribute to the overall energy mix and their impact on the environment. By leveraging this analysis, you can better understand the role of renewable energy, optimize the grid, and track your carbon footprint.
To kickstart your project, consider these key datasets:
- Energy Production Data: Information on electricity generation from various sources like coal, natural gas, solar, and wind.
- Energy Consumption Data: Records detailing how energy is used across different sectors.
- Environmental Impact Data: Data on emissions and pollution from different energy sources.
- Grid Performance Data: Metrics on grid reliability and efficiency.
In Power BI, use visualizations like line charts to show trends in energy production, pie charts for energy mix composition, and heat maps to illustrate regional energy consumption.
These insights can drive substantial business applications:
- Grid Optimization: Improve energy distribution and reduce losses.
- Sustainability Trends: Monitor progress toward sustainability goals.
- Carbon Footprint Reduction: Identify areas to cut emissions.
- Policy Development: Inform decisions on energy policies and investments.
#7 COVID-19 data insights
Explore COVID-19 data insights with Power BI to uncover patterns and trends that can inform public health decisions and strategies. By leveraging this powerful tool, you can analyze vaccination rates, economic impact, healthcare capacity, travel restrictions, and supply chain disruptions.
This intermediate project involves using key datasets like COVID-19 case numbers, vaccination statistics, hospital occupancy rates, and economic indicators.
In Power BI, create visualizations such as line charts to track vaccination rates over time, bar charts to compare economic impact across different regions, and heat maps to show the strain on healthcare capacity.
Additionally, use scatter plots to visualize the correlation between travel restrictions and COVID-19 case surges. For supply chain disruptions, a Sankey diagram can illustrate the flow and bottlenecks of critical supplies.
Advanced Projects
#8 Customer churn prediction
Predicting customer churn is crucial for businesses aiming to retain their customer base and maximize revenue. Using Power BI, you can implement advanced customer retention strategies through data-driven decision-making.
Begin by gathering key datasets, such as customer demographics, transaction history, and interaction logs. This data is essential for effective customer segmentation analysis, which helps tailor retention efforts to different customer groups.
Incorporate predictive modeling techniques to forecast which customers are most likely to churn. By visualizing these predictions in Power BI, you can quickly identify at-risk customers and prioritize intervention efforts.
Here’s a structured approach to guide your project:
- Data Collection: Gather relevant datasets, including customer demographics, purchase history, and engagement metrics.
- Data Analysis: Use Power BI’s analytical tools to perform customer segmentation analysis, identifying patterns and trends.
- Predictive Modeling: Apply advanced techniques to model churn probabilities, leveraging machine learning algorithms.
- Visualization and Insights: Create dashboards to visualize churn predictions, segment analysis, and potential retention strategies.
These steps not only assist in crafting effective retention strategies but also provide a thorough business impact assessment. By continuously monitoring and refining your models, you can make more informed decisions, ultimately reducing churn and driving business growth.
#9 Loan application analysis
Analyzing loan applications with Power BI allows you to uncover insights that can streamline decision-making and mitigate risk. By diving into loan approval rates, you can identify patterns and factors influencing approvals. This can help you refine your criteria and improve your acceptance strategies.
For effective credit risk assessment, Power BI lets you visualize and analyze applicant data, such as credit scores and financial histories. You can create sophisticated dashboards that highlight high-risk applications, helping you make informed decisions quickly.
Tracking application processing times is another critical aspect. With Power BI, you can monitor the efficiency of your loan processing workflows. Visualizations can pinpoint bottlenecks, enabling you to optimize processes and reduce delays.
Default prediction models are essential for anticipating potential loan defaults. By integrating machine learning models into Power BI, you can predict which customers are likely to default and take preemptive actions.
Lastly, understanding customer loan trends offers valuable insights into borrower behavior. Analyzing trends over time can help you identify shifts in demand, seasonal patterns, and the effectiveness of your marketing campaigns.
Incorporating these elements into your loan application analysis with Power BI can greatly enhance your financial decision-making capabilities.
#10 Airport operations analysis
Airport operations analysis with Power BI enables you to uncover critical insights that can enhance efficiency and improve passenger experience. By diving into airport traffic analysis, flight delay tracking, and passenger satisfaction surveys, you can develop a thorough understanding of your airport’s operations.
Key datasets for this project include:
- Flight schedules and delays: Track and visualize delays to identify patterns and improve on-time performance.
- Passenger feedback: Utilize survey data to gauge passenger satisfaction and pinpoint areas for improvement.
- Baggage handling metrics: Analyze efficiency in baggage processing to reduce mishandling and enhance service.
- Gate usage logs: Optimize gate utilization to minimize turnaround times and enhance operational efficiency.
In Power BI, you can create relevant visualizations such as heat maps for delay hotspots, trend lines for satisfaction scores, and bar charts for baggage handling performance. These visualizations offer clear, actionable insights.
Potential business insights include identifying peak traffic periods, highlighting frequent causes of delays, and understanding passenger pain points. By optimizing gate utilization and improving baggage handling efficiency, you can streamline operations and boost overall airport performance.
This advanced project not only equips you with essential skills but also contributes significantly to enhancing the passenger experience.
#11 Life expectancy data analysis
Shifting from airport operations to global health, a fascinating advanced project in Power BI involves analyzing life expectancy data to uncover critical trends and disparities across different regions. By diving into global trends, you can identify how life expectancy varies worldwide, revealing the impact of healthcare systems, economic conditions, and social policies.
Start by gathering key datasets from sources like the World Health Organization or national health departments. These datasets should encompass demographic factors such as age, gender, and socioeconomic status, alongside regional disparities in healthcare access and quality.
In Power BI, you can create compelling visualizations like heat maps to highlight regions with the highest and lowest life expectancies. Scatter plots can be used to examine the relationship between healthcare spending and longevity predictors, while line charts can track how life expectancy has evolved over decades.
#12 Movie sales visualization
Immerse yourself in the thrilling world of movie sales visualization in Power BI to uncover valuable trends and patterns in the film industry. This advanced project leverages key datasets such as box office earnings, movie genres, actor profiles, and distribution channels. By analyzing these datasets, you can create insights that drive decision-making.
- Box office trends: Visualize box office performance over time to identify seasonal patterns and blockbuster spikes. Use line charts to show weekly or monthly revenue changes.
- Genre comparison: Compare the profitability of different movie genres. Bar charts and pie charts can help you see which genres dominate the market and which ones lag.
- Revenue forecasting: Apply predictive analytics to forecast future box office earnings. Utilize scatter plots and trend lines to project future revenue based on historical data.
- Actor popularity: Assess how different actors impact movie sales. Heatmaps and bubble charts can illustrate the correlation between actor popularity and box office success.
Additionally, you can conduct a thorough distribution analysis to understand which platforms (e.g., theaters, streaming services) contribute most to a film’s revenue. These visualizations aren’t just eye-catching; they’re powerful tools that can guide strategic decisions in marketing, production, and distribution.


